|
|
|
|
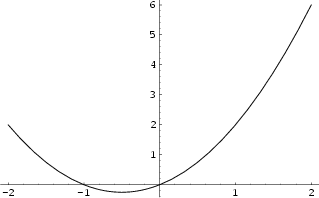
Technically, the graph of a function is its Range
(a.k.a. image). Informally, given a Function
![]() defined on a Domain
defined on a Domain ![]() , the graph of
, the graph of ![]() is defined as a Curve or Surface showing the values taken by
is defined as a Curve or Surface showing the values taken by
![]() over
over ![]() (or some portion of
(or some portion of ![]() ),
),
Good routines for plotting graphs use adaptive algorithms which plot more points in regions where the function varies most rapidly (Wagon 1991, Math Works 1992, Heck 1993, Wickham-Jones 1994).
See also Curve, Extremum, Graph (Graph Theory), Histogram, Maximum, Minimum
References
Cleveland, W. S. The Elements of Graphing Data, rev. ed. Summit, NJ: Hobart, 1994.
Heck, A. Introduction to Maple, 2nd ed. New York: Springer-Verlag, pp. 303-304, 1993.
Math Works. Matlab Reference Guide. Natick, MA: The Math Works, p. 216, 1992.
Tufte, E. R. The Visual Display of Quantitative Information. Cheshire, CN: Graphics Press, 1983.
Tufte, E. R. Envisioning Information. Cheshire, CN: Graphics Press, 1990.
Wagon, S. Mathematica in Action. New York: W. H. Freeman, pp. 24-25, 1991.
Wickham-Jones, T. Computer Graphics with Mathematica. Santa Clara, CA: TELOS, pp. 579-584, 1994.
Yates, R. C. ``Sketching.'' A Handbook on Curves and Their Properties. Ann Arbor, MI: J. W. Edwards, pp. 188-205, 1952.
![]() Graphing
Graphing