|
|
|

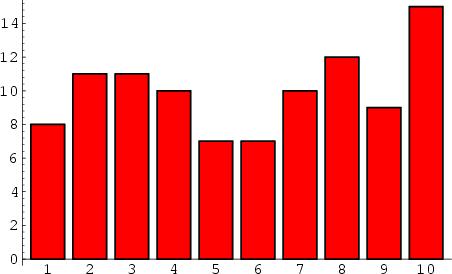
The grouping of data into bins (spaced apart by the so-called Class Interval) plotting the number of members in each bin versus the bin number. The above histogram shows the number of variates in bins with Class Interval 1 for a sample of 100 real variates with a Uniform Distribution from 0 and 10. Therefore, bin 1 gives the number of variates in the range 0-1, bin 2 gives the number of variates in the range 1-2, etc.
See also Ogive